
Part 1 of 2 covers iPad Pro 9.7.
* (For the year; in annual revenue terms; maybe. More on this later.)
To radically oversimplify what happened during Apple’s March 21 event,
• Apple brought the prior “full-size” iPad “upmarket” with iPad Pro 9.7,
• while bringing an impressive swath of upmarket features to the iPhone 5S “shell” in the form of iPhone SE, while also lowering the “most affordable iPhone” price floor to $399 (US) from the prior $449 that’s been in place since…probably the days of iPhone 3GS becoming Apple’s first “free on 2-year contract” phone (remember those?) circa October 2011, nearly 4.5 years ago.
But what do iPad Pro 9.7 and iPhone SE mean in terms of impacting Apple’s revenues? Do these products even make much of a difference?
After all, Apple’s FQ1 (FQ = Fiscal Quarter) 2016 results and conference call (citing, among other factors, strong global macroeconomic headwinds) have a lot of people – including your humble correspondent – wondering if Apple can grow revenues at all from FY (Fiscal Year) 2015. (Case in point: All those analyst revisions seeing Apple annual revenues down about 2.7% YOY on Yahoo! Finance as of March 29, 2016 – it wasn’t always that way.)
I’ve been thinking about the revenue impact question here and there since the March event rumors started popping up, and while this blog never does treatises, I do have something of an outline, home-game-humble like always, for your “consideration”. So let’s look at how iPad and iPhone SE might, within a year of launch, get Apple around 1/10th of the way to its current, $230B-ish level of annual revenues.
iPad
For Part 1 of this series (TL;DR advisory but you knew that already), we’ll focus on iPad Pro 9.7’s potential contribution to the top line. Phil Schiller didn’t provide a particularly precise clue (Apple execs never do), but it was still very helpful (about 45:30 in):
…and from the beginning [9.7″ iPads have] remained our most popular iPad size. In fact I’m really happy to tell you that to date we’ve sold over 200 million iPads with a 9.7″ display…
A fair number of iPads, iPad 2s, maybe not as many iPad 3s, iPad 4s, iPad Airs and iPad Air 2s, considering.
As usual, try some other place for the post-doctorate math, but here’s my own take on how Apple could sell around 15 million iPad Pro 9.7 units in about a year’s time.
Step 1: How many iPads has Apple sold to date, whatever the size?
Around 308.16 million, based on quarterly earnings releases – which doesn’t include the, who knows, 8 million to 11 million iPads sold in FQ2 (which just about ended as of the Apple event), depending on how gloomy you are on iPad.
Note that I’m not considering FQ2 in this post, but I wouldn’t count on FQ2-interval unit sales being a significant part of the intentionally vague “over 200 million 9.7″ iPads to date”, given the “stale” Air and non-price-dropped Air 2 on offer from January to mid-March.
So I think it’s safe to say Apple sold no less than 197M 9.7″ iPads or so through FQ1 2016…hence, we’re sticking to the 200M through FQ1 2016 number.
Step 2: How many 9.7″ iPads did Apple sell before the arrival of iPad mini?
iPad mini launched in November 2012, well into FQ1 2013. So it’s a relatively simple matter to add up all report iPad sales from FQ4 2010 through FQ4 2012 – about 98.16 million units.
That leaves another 210 million iPad units to sort out (nice round number!), and here…you need to take a leap of faith or two. 😀
Step 3A: What’s a half-decent guess on the approximate iPad share of 9.7″-screened iPads over the past fiscal year?
This…could take a little work.
We know that of the 210 million iPads sold between FQ1 2013 and FQ 2016, around 100M or so were 9.7″ iPads. That’s easy.
iPad Pro isn’t going to play much of a role here, in my opinion. If you’d like to know the “why”, you can check out the footnote.[1]
“100 million or so” 9.7-inch iPads sold in the approximate space of three years (out of 210 million), means that while Phil Schiller’s statement of this iPad size being the most popular in iPad history is true, it’s not necessarily true in the context of post iPad mini introduction. “3-year” iPad 9.7″ share @ 102-ish million units is 48.5%, a bit shy of half.
We probably shouldn’t stop there though, because iPad mini obviously has its own growth curve. And iPad ASP (average selling price) has been trending downward over time, bouncing between $410ish to $430ish lately. Maybe a quick look at overall ASP can help us get a vague sense of iPad 9.7 share over the past year.
I charted three items: ASP, YOY ASP change (from the year-ago FQ), and “% of ASP compared to the year-ago FQ”, to get a better sense of relative ASP trending. Since a three-axis chart is beyond my comprehension and your patience, I broke out the three columns of data into two simple charts instead (click to view full-size).


The first chart tracks iPad ASP since the first FQ of sales on the primary axis, and YOY ASP change on the secondary axis. Note that iPad ASP was downtrending “quite nicely” before iPad mini’s introduction – it was already around $508 in FQ4 2012, and there was a fair chance it would’ve dropped to the high $400s without iPad mini’s help.
In fact, by the time iPad mini launched in FQ1 2013 (green line), YOY ASP declines had already “rebounded” from their “lowest” point. Without a serious change in iPad mini market dynamics, ASP may well begin a trajectory of steady-if-modest increase from the $415 all-time low set in FQ3 2015. After all, as of this year, most of iPad’s incremental change has been concentrated in the iPad Pro 9.7+12.9 category.
The second chart is a zoomed-in look on iPad mini’s effect on ASP (green dotted line charting “how much of the year-ago average selling price the current ASP is”, with >100% representing an increase). It make the four YOY increases in iPad ASP a bit easier to follow. FQ2 and FQ3 2014 were the first post-iPad-mini ASP increases (a solid argument could be made that the “more expensive” iPad mini 2 intro’d in FQ1 2014 helped in this regard). Next were two consecutive YOY gains in ASP beginning FQ4 2015 – even though iPad Pro 12.9 (price range $799-1229!) and iPad mini 4 (price range $399-729) would not be introduced until FQ1 2016.
Really, if not for that “outlier” iPad ASP spike in FQ2 2014, the overall ASP trend would look quite boringly stable since FQ3 2013.
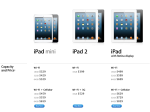
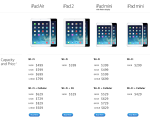
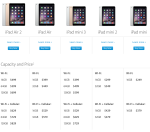
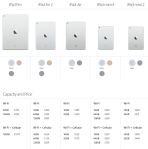
Before moving on to the final horseshoe-tossing step (iPad Pro 9.7 units and ASP) it might be useful to recall Apple’s “New iPad Harvest” prices from each of the past four fiscal years, so as to better derive some kind of 9.7″ iPad share reference point. Luckily, Apple’s made comparing iPad lineup pricing very easy over the past several years, so the good ‘ol Wayback Machine plus screen captures can take care of the rest. Yes, there were a few product changeups between these iPad announcements – they aren’t particularly material.
For some additional context, and since viewing charts on mobile can be a pain, I’ve included some notes and narrative by calendar year – though you can skip them if you want and head straight to Step 3B (ugh, right).
* * * * * * * * * * * *
2013: In late December 2012 (end of FQ1 2013), iPad ASP began the fiscal year at about $467, with the first batch of iPad minis being sold (at a healthy clip). For FY 2012, 58.31M iPads (all 9.7″ models) were sold on a GAAP sell-in basis. iPad mini prices ranged from $329-659 US with the familiar $100 steps to the next highest storage capacity, and the exact same $130 premium (which I can only interpret as mostly margin) to add cellular data access. iPad 2 (a.k.a. the First Zombie iPad) only sold for $399/529 in a 16GB model. As iPad 3 owners remember all too well, iPad 4 was the new full-size iPad in town after a barely-7-month run of the A5X chip, offering the same 16/32/64GB storage options as iPad mini at price points $499-$829.
2014: At the end of FQ1 2014, iPad ASP had fallen to $440 – though the total ASP variance for the trailing 12 months (more or less) was less than $10 ($439.38-$448.97). In other words, iPad ASP was quite stable from quarter to quarter. Unit growth was present but cooling down – for FY 2013, 71.04M iPads were sold. The iPad lineup had just expanded to four new iPad models. iPad 2, rather disappointingly, soldiered on at the same $399/529 price points – making it a strong candidate for Least Popular iPad. iPad Air, meanwhile, brought a significantly thinner and lighter full-size iPad, with an iPad mini-like redesign and what history now suggests was a higher-TDP Apple A7. A 128GB option was added, expanding the iPad Air price range from $499-929. In terms of minis, the iPad mini 1 did get a price drop of $30 (beats nothing, I suppose), with $299/429 price tags at the same 16GB flash storage that Apple’s finally started to move away from. And to round out Apple’s holiday lineup, the “basically an iPad Air, just smaller pixels” iPad mini retina (now iPad mini 2) sold in a $399-$829 price range.
At that point I don’t think I was alone in believing this would have a significant upward influence on iPad ASP. Well, I was wrong.
2015: At the end of FQ1 2015 – hello, iPhone 6 – iPad ASP, “despite” iPad Air and mini 2, had just hit a new low of $419.47, its third consecutive sequential decline from a high of $465.44. Negative unit growth had taken hold – for FY 2014, 67.99M iPads were sold. But you wouldn’t see any signs of retrenching from Apple. iPad Air, 2-3 generations superior, took the reins from iPad 2, adding a 32GB storage option and charging $50 more for it instead of $100, harmonizing with the iPhone 5s. And so “the budget full-size iPad” (hello A7 chip, goodbye A5 forever) now sold in a price range from $399-579. iPad Air 2 gained additional relative value at reduced cost beyond the 16GB base model, offering 64GB and 128GB storage at the old 32GB/64GB price points. As such, price range returned to $499-829.
In iPad mini-land, mini 1 (“why are you still here? I mean I know why, but do you have to be?”) proudly took the dubious mantle of Zombie A5 iPad from iPad 2 at the thankfully lower Wi-Fi/LTE price points of $249/379. The “if you can afford it, buy it” iPad mini 2 was the best value buy of the bunch, price-dropped $100 and selling between $299-479. Then, there was iPad 3, which…um…added a Touch ID sensor and pretty much nothing else?, selling between $399-729.
iPad mini 3 disappointment aside, iPads were priced better than ever, backed by iOS 9. But negative growth would remain a constant theme.
2016: Finally, we’re in the present. At the end of the December 2015 quarter, iPad ASP was up to $439.45, the second consecutive ASP increase and the highest ASP since five fiscal quarters ago, despite lower prices across the board. For FY 2015, iPad unit sales fell to 54.85M, the lowest trailing-four-quarters number since FQ4 2012. iPad Pro 12.9 launched in prices from $799 all the way up to $1229, but unit mix seems quite modest for now. iPad Pro 9.7 models sell from $599-1029, with 256GB storage options the non-Pro iPads lack. iPad mini 2, iPad mini 4 and iPad Air 2 have a combined total of 14 price points ranging from $269-629.
* * * * * * * * * * * *
Step 3B: Completely wild-#$$-guess iPad Pro 9.7 demand for its anticipated 12-month new product lifecycle, and arrive at a revenue number.
I had a so bad it’s good pun ready here, but since we’ve slogged through plenty enough I’ll spare you further punishment. Luckily, Part 2 (iPhone SE) doesn’t require all of this context and solving-for.
After some daydreaming and a little Excel scribbling, I’m thinking that iPad mini, as of the four fiscal quarters prior to iPad Pro 9.7 launch, could be around 60% of iPad unit sales, but not much more. Is there any way to prove it? With all of the overlapping price points and points of sale, absolutely not 😀 . However, we do have one “heuristic” which isn’t too shabby: A whole bunch of iPad mini SKUs have sold for $100 less than their full-size iPad equivalents (until iPad Pro, anyway). Assume a 50/50 mix, and all things being equal, you can kinda sorta see a $50 ASP “dilution”. Of course, ASP, prior to iPad mini 1’s introduction, was $508.
So why not 70/30 mix (70% minis, 30% 9.7″ iPads) since ASP was most recently in the $430s? Well, it’s possible, but 1) iPad ASP was already plummeting like a rock from the $600 level before iPad mini 1 launched, and 2) if you remove a few outliers, ASP has actually been quite steady since FQ3 2013, mere months into the launch of iPad mini 1 (with iPad line unit sales about to hit a plateau around the same time). Point is, I don’t think the available data is telling us that iPad mini has an overwhelming share of iPad unit sales.
Finally (FINALLY!), to solve for iPad Pro 9.7 units and ASP. First, I’m “projecting” a 40%/50%/10% mix of 7.9-inch iPads, 9.7-inch iPads, and iPad Pro 12.9s respectively. Air 2 is now at the price point consumers have been anticipating since the end of last year (with more SoC performance than the new, same-price iPad mini 4), and more importantly, iPad Pro 9.7 should meet a degree of pent-up demand for those who’d been waiting on a new iPad at that screen size. As for iPad Pro 12.9, I don’t think less than 6 million units sold in a year’s time is too much to ask, considering the countless points of sale and worldwide celcos (and, uh, IBM) that can supplement Apple’s direct channel sales efforts. That same IBM, along with Apple’s existing corporate customers, will find a iPad Pro “for $200 less than the 12.9-inch iPad Pro” an easier sell to IT, even though consumer demand may be affected by the lack of a $499/629 entry-level Pro option.
How many iPads can Apple sell in any given 12-month period, with no downtrend relief in sight? Well, I’m guessing that the YOY declines will slow on the overall strength of the newest iPad lineup, plus a renewed push into corporate IT with the two iPad Pros. 9to5Mac’s Mark Gurman, who has a great track record, cites “multiple sources” noting Apple’s ambitions, stated in an internal Apple Town Hall event, to actually grow iPad revenue at some point before year-end. So…how about 50M iPad units sold in a 12-month period – more or less a 9% YOY unit decline.[2]
50% of 50M units nets out to 25M 9.7-inch iPad units in 12-month period.
Of that, I’ll “project” that at least 15M (60%) 9.7-inch iPad units will be Pro 9.7s (See: pent up demand, unlocking additional corporate sales with partners such as IBM)
At long last, a very quick ASP projection for iPad Pro 9.7. I’ve kept it very conservative at $670, even though iPad Pro 9.7 prices span all the way up to $1029. The key assumption: roughly 2/3 of all units sold are of the $599 base model.
15M iPad Pro 9.7 units (a bit high?) @ $670 each (a bit low?) equals about $10B in iPad Pro 9.7 line annual revenue…which Apple would hope, like all of its core product lines, grows over time.[3]
Ah, but a mere $10B isn’t 9-10% of the way there for Apple’s annual revenue, is it? The remainder – I’d say, the majority – derives from iPhone SE, the subject of my second and final (and way shorter) post in the series.
[1] iPad Pro’s not meant to be Apple’s volume seller. And odds are it didn’t sell “many” units in FQ1 2016, though to be fair, it launched roughly mid-way through FQ1. Why do I think that? Well, total iPad “ASP” (which isn’t quite line revenues divided by units sold, as I’ve mentioned before, but let’s just go with it) from FQ4 2015 to FQ1 2016 was…
…about $432.79 to $439.45.
Yes, it’s not that simple – but all things being equal, if you assume a static ASP for all non-Pro iPads sequentially, and assume “just” 1 million iPad Pro units were sold in Apple’s FQ1 2016, with a very conservative ASP of $849, ASP would then become $458.61. Cut that iPad Pro number down to 500,000 units, and ASP is still about $445.70. The key takeaway, since iPad ASP has not yet “threatened” to breach the $400 level, is that iPad Pro is probably a non-factor for purposes of this post. I’ll “ignore” it, but if you’re thinking 1-2 million iPad Pro 12.9s sold or whatever, that’s fine by me.
* * * * * * * * * * *
[2] I’m guessing that the iPad unit decline will be “better than feared” because, among other things, iPad Pro has had little time to benefit sales/gain customer acceptance given its high-end/niche status and very recent introduction. More importantly, the expected iPad Air 2 replacement never materialized in late 2015 (not even an Air 2 price drop), making FQ1 2016 units (and iPad’s trajectory) look worse than it would have been with the March 2016 9.7-inch iPad lineup.
* * * * * * * * * * *
[3] Why might 15M iPad Pro 9.7 units be too high a number? iPad has not shown any signs of exiting its 8-consecutive-FQ unit downturn on a YOY basis. You’ve got continued Mac relative strength and consumer uptake of “competing” iPhone 6/Plus series pressuring iPad in both the total addressable dollar and “device roster” realms.
A few reasons why this 15M number may actually be low: iPad Pro has some iPad exclusives that appeal to multiple demographics: 4K recording and A9-associated 12MP rear camera (hello, first-ever iPad LED flash, which I certainly do appreciate for lighting purposes) + 5MP front camera/Retina Flash optics. It’s a corporate-grade iPad now starting considerably below iPad Pro’s $799+ “Fortune 500-class” starting price. Apple explicitly aims to drive PC conquest sales and is the providing necessary hardware accessory packaging (keyboard case plus Apple Pencil) to enable these conquest efforts.
