
Quiet trading day. Well, relative to the past three.
While we wait to see if AAPL can work its way over the mega-macro trendline (it tried, but closed a few points shy), why not go looking for more fragments of potential clues?
3-minute chart:
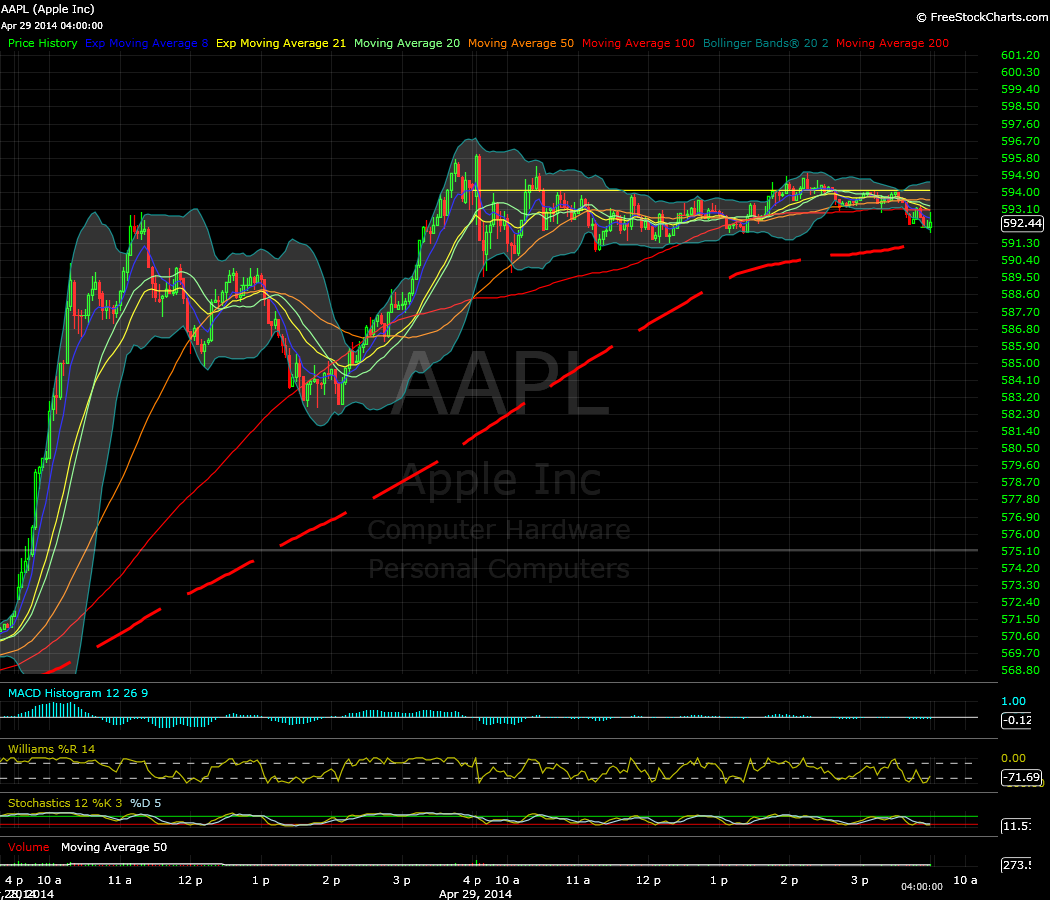
– AAPL hasn’t found any additional momentum yet, but it’s a bit early to call for a significant retrace. If you look really closely, you might see a micro head and shoulders pattern for all of two points…that already triggered. In the context of the past three days, it’s practically “nothing”.
– Not much in the way of recent reference levels, but 589.50-590.25 or so looks like a place to watch for shorter-timeframe traders. That narrow price brand (which is basically “590-ish”) acted as resistance for some of yesterday, and as support earlier today.
– If there’s a bull flag in play from yesterday afternoon’s move, one might expect a measured move of about a dozen points from wherever the breakout point is. The bears might say that bulls had a golden opportunity to “capitalize” on a very nice intraday consolidation/wedge pattern, but that the breakout attempt from about 1:30PM Eastern failed. My non-expert take? Let’s see how things look when AAPL holds above 595-ish or falls below 590-ish. I know, call me your source for bold market calls each and every day. 😛
15-minute chart:
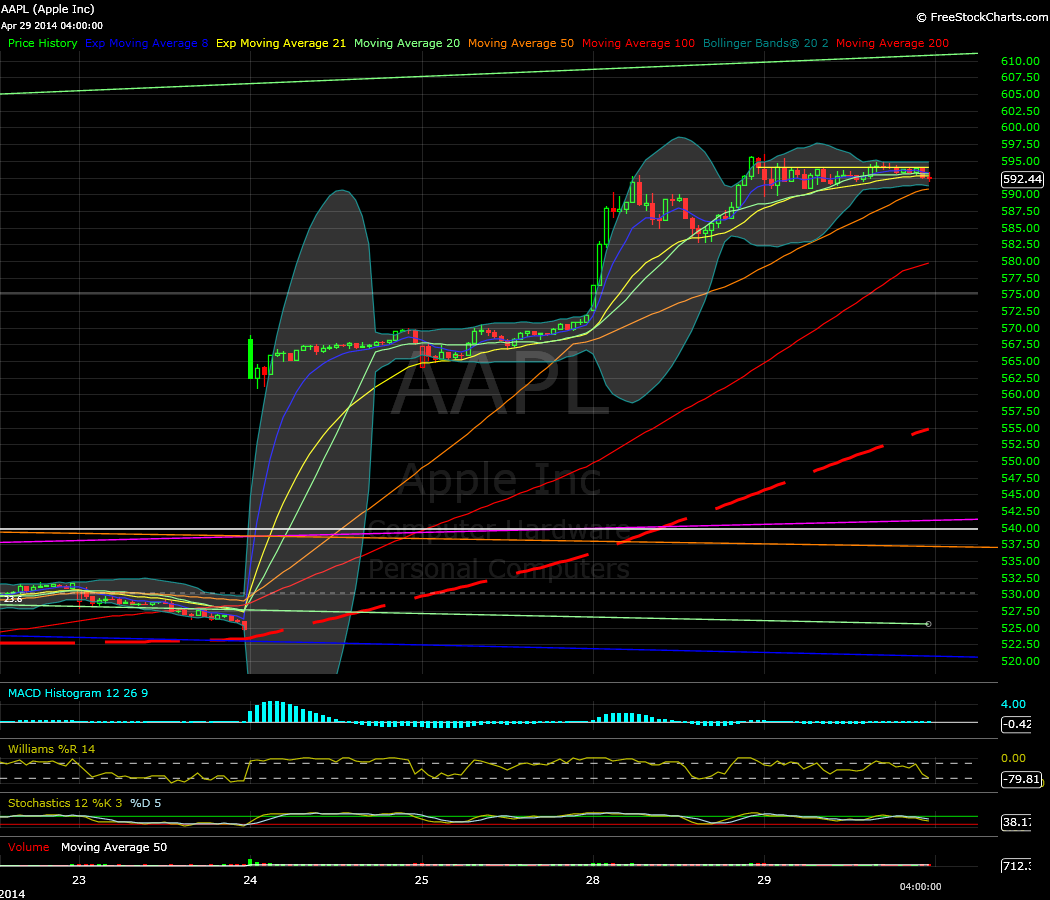
– Bollinger Bands are narrowing on this timeframe, but we’ve seen AAPL trade within a “small” micro range for quite a while in recent, pre-earnings days, so in a way it’s “back to normal”. We’ll just have to wait and see if AAPL moves significantly in either direction once there’s a “definitive” resolution of the temporary price “indecision”.
Daily chart:
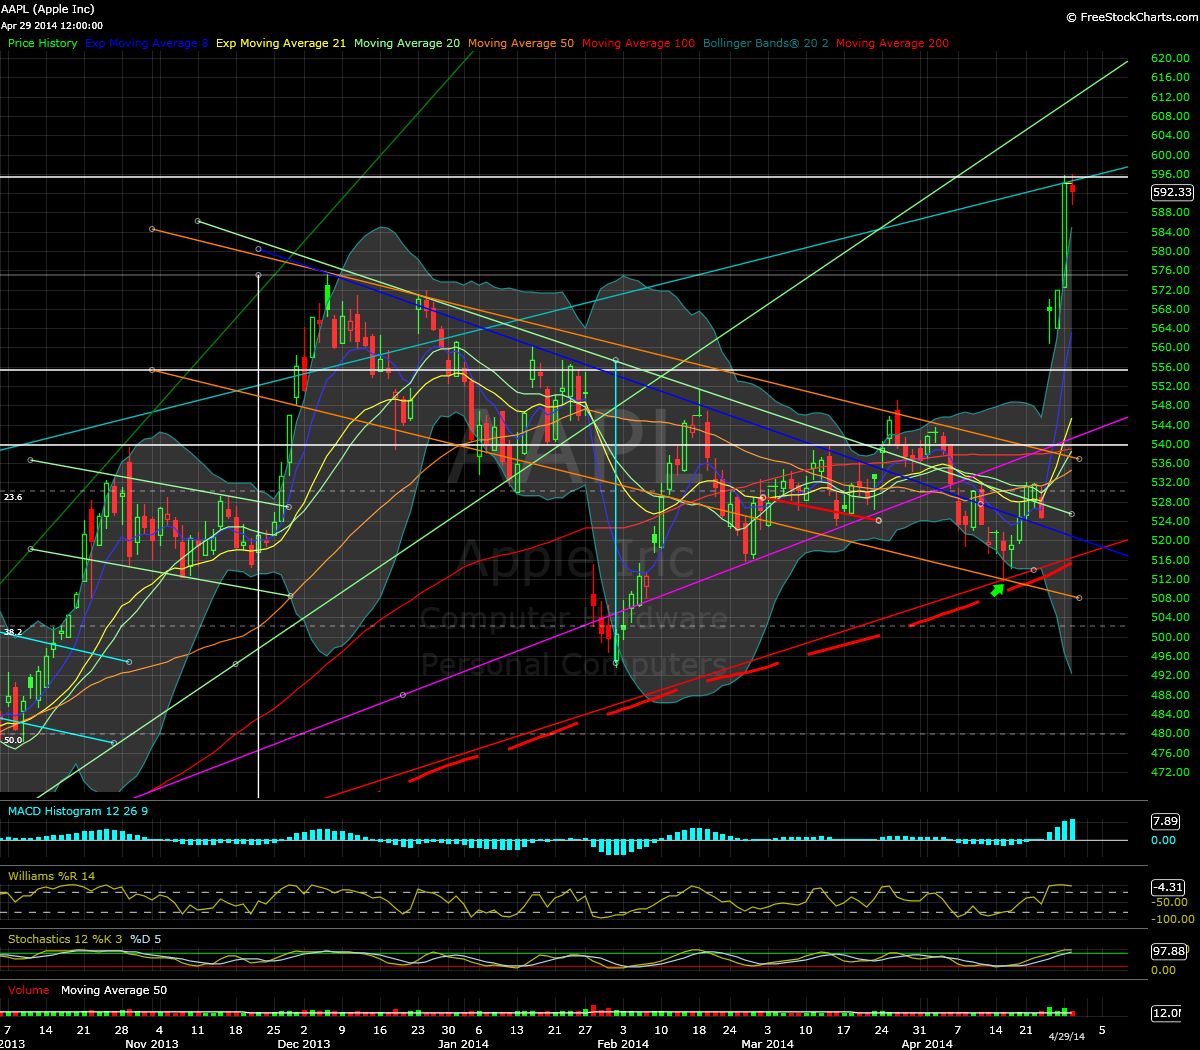
– There are worse ways to end a three-day power move as the Bollinger Bands and EMA-8 “try to catch up”. AAPL has retained the great majority of yesterday’s gains, to say nothing of the move from the 520s. Granted, it only made about a quarter’s worth of progress over yesterday’s high before fading a little. But a slightly higher intraday high and a sorta-doji candle beats something scary like an inverted hammer any day of the week (if you’re bullish on AAPL, anyway).
– One note of possible “caution”. The current breakout move is around 65 points, give or take a few. The late November-to-early December move from last year? Around 60. The move before that, which happened over about 15 trading sessions last October? Yep, about 60 points from the lowest point. The seven-or-so trading day power move from the sharp-yet-controlled falling-wedge-type formation last August, during which time Uncle Carl announced his stake in AAPL? …You guessed it, about 60 points.
– Then again, the previous two measurable moves starting late June and late July were both about 50 points, so there’s that for potentially nervous bulls.
It’s still early days this rally. Let’s see if AAPL can make another statement by holding the mega-macro trendline for at least a day (always nice when it’s validated as a price action reference), or if AAPL may need some time to consolidate at the very least.
Best of luck with your Camel Day trading tomorrow.
