Wow.
Y’know, when I thought out loud about a measured move target of 590 or so…I wasn’t thinking today.
So, hyper-bullish explosion of a day, though with a considerable intraday retrace for a couple of hours. Not like anyone really knows where AAPL goes from here, but let’s see if the charts hold any hints of clues.
3-minute chart:
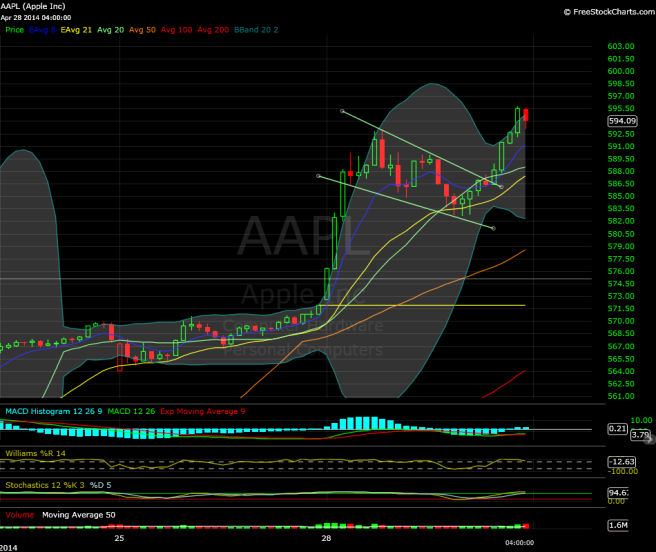
– I know, a much shorter timeframe than I usually track, but since it was obvious even to me, I had to point out that micro head and shoulders that formed between late breakfast and lunchtime (Eastern time, of course).
– Wish I’d seen it coming, but hey, intraday trading isn’t for everyone. A tremendous move up from the opening bell (not much of a gap either), a classic bull flag around 590 suddenly giving way to every bull’s favorite pattern 😛 , a measured move of about 5 points from a neckline of around 587, and what do you know, AAPL dips around 10 points from highs to 582-ish.
– But then, an impressive recovery/finish, which might be partly due to the other intraday formation my non-expert eyes picked up (much to late to act on, but c’est la vie)…
15-min chart:
– Huh. Correct me if I’m wrong, but that looks like a pretty clean intraday descending channel/falling wedge-ish formation.
– As a bonus, AAPL launched fairly well from the channel/wedge/mild volatility compression with MACD-h/oscillators returning to bullish territory, even though AAPL ran out of gas just a bit in the final 15 minutes.
– No, I’m not about to call a price target (though if it ends up in the ballpark…so called it). But it looks like the intraday breakout might be good for a little extra upside based on the channel breakout, IF some momentum remains. An “optimistic” read of the micro pattern has a measured move of around 20 points, with the target being a bit over 600 or maybe 605, depending on where you measure the breakout point. The most conservative read of the pattern I can discern has a measured move of more like 17.5 points, with a measured move target of around 600. We’ll see about tomorrow.
Daily chart:
– Gap up/hammer candle, outside day, rocket launch. You mean this isn’t NFLX back when it was in EternaBull™ Mode? (Actually, a cursory glance at NFLX, TSLA and AMZN doesn’t seem to show a recent sequence anything like this. Interesting.)
– Nothing new to say here…still really bullish, and big-time volume at close to 24M shares traded. Still the same notes of caution for elevator-type price action that leaves “implied boundaries” like moving averages and Bollinger Bands behind. So I guess that’s…wait, there is that light blue line. Haven’t we seen it before, at least before I had to adjust it a bit?
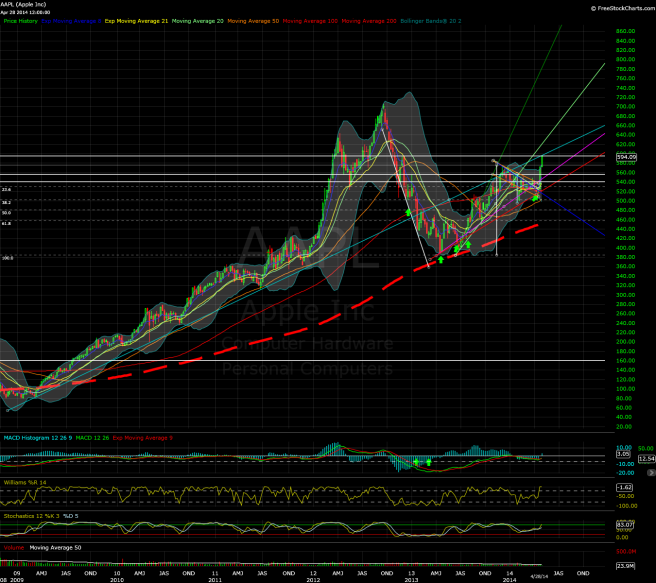
– Yep! I call it the potential “mega-macro trendline”, since it’s been quite instructive as a general reference since March 2009. Granted, it only has two connecting points on the weekly chart below, but I’m sure there’s additional contact points on the daily timeframe. AAPL’s currently attempting to “reclaim” it after over two years of trying and mostly failing.
Can AAPL’s rally continue in the weeks up until WWDC? Are we “due” for a bullish break at the very least, or will AAPL find itself on the “right” side of the light blue trendline?
We’ll see. Good luck to all during the Tuesday session!


