“What’s this stock?”
“Some smartphone/tablet, software and services company. Their stuff’s supposed to be easy to use.”
“I’m not gonna buy it.”
“Let’s get Mikey!”
“Yeah!”
“He won’t buy it, he shorts everything.”
“He likes it! Hey Mikey!”
I’ll be here all week. 😀
AAPL’s handled the two recent Trials of Sentiment with aplomb. I’m not sure the market’s fully “accounted for” the uncertainty surrounding the share split (could just be me, though did you see VXAPL tank 10% today?), but let’s have a quick non-expert’s look at the charts anyway.
(Click for full resolution charts)
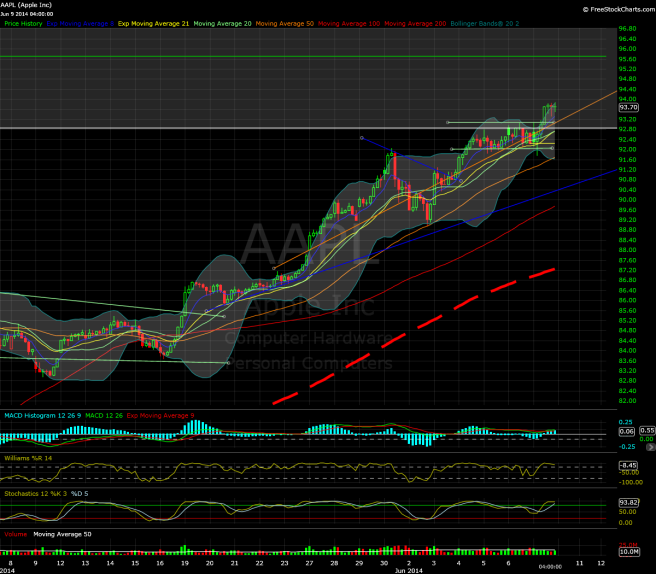
5-min chart:
– Apparently, it was the “constructive trading/consolidation theory” (from the weekend chart post). “Until it isn’t”, at least.
– Some head-and-shoulders-esque bearishness (magenta-ish line) that resulted in a short-lived dip, ending up with a quite-nice micro timeframe bull flag to end the day. If it triggers, it implies a measured move of, say, 2 points from any breakout point. (Still getting used to dividing by 7.)
– Overall, AAPL’s micro price action is still very methodical. Move up, consolidation (if sometimes a bit choppy). Another move up, trading more or less within a channel for roughly 3 trading days’ worth of time. Then another move up, and no respite for bears in sight. Of course no one knows how AAPL will resolve the bull flag yet, but as the clock ran out, them Bulls (no, not the NBA team) sure seem to have a solid lead at the end of the quarter. Er…fifth.
Hourly chart:
– A nice resolution of the volatility compression situation on the hourly chart, though it seemed a little touch-and-go in the first couple hours of trading. Considering everything, though, the choppy trading at least seemed understandable, and the very quick break below the lower Bollinger Band ended up being range expansion to the upside, yet again.
– Could be just me again (often is), but AAPL’s rejection of definitive downside range resolution in mid-May, then Jun 2, then today, looks like a sorta-pattern worth watching (particularly when you look back to around May 1 and May 7-9 or so). If that sorta-pattern changes, might that be an early indication that the bullish trade is losing steam?
– In any case, it’s hard to draw bearish conclusions on this timeframe just yet in my humble opinion. MACD-h and oscillators certainly seem bullish enough for now, and an up day of 1.6% where the SPX couldn’t even manage 10 basis points of upside (some of that thanks to AAPL) speaks for itself.
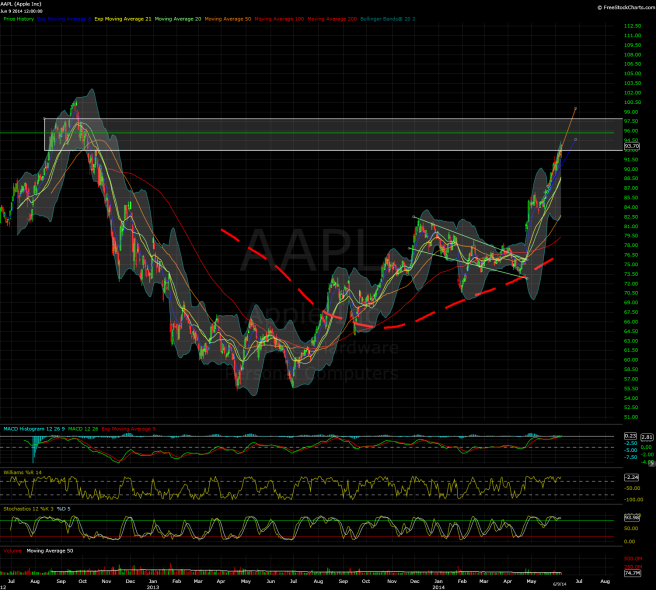
Wrapping up with the daily chart:
– AAPL steps into the former 650-685 (now 92.85-97.85ish) battlefield/unknown zone. So far, so good, so far. If you’ve seen my previous chart posts, it seems there’s potential bullish objectives in the 95-96ish (former 670) and 100ish (former 700ish) range. Will AAPL eventually reach them, of course, is the more important question.
Mikey Market’s quite fond of his *ahem* “AAPL Jacks” (yes, I just mixed up my cereal companies) as of today, but he’s a notoriously picky eater, and we all know his AAPL-specific temper tantrum wasn’t pretty for bulls back in October 2012. Just have to wait and see where things go from here.
See you on the virtual exchange tomorrow.


