No, I’m not saying it’s “too quiet” or that AAPL’s merely taking a break before still more selling. I know enough to know I’m not cut out for the actionable advice business (WAGs, that’s a different deal. :P)
But with volume this low (and it’s not even a holiday!), I think “very quiet” is more than appropriate. That said, let’s see if the charts hold any semi-clues today.
(Click for full resolution charts)
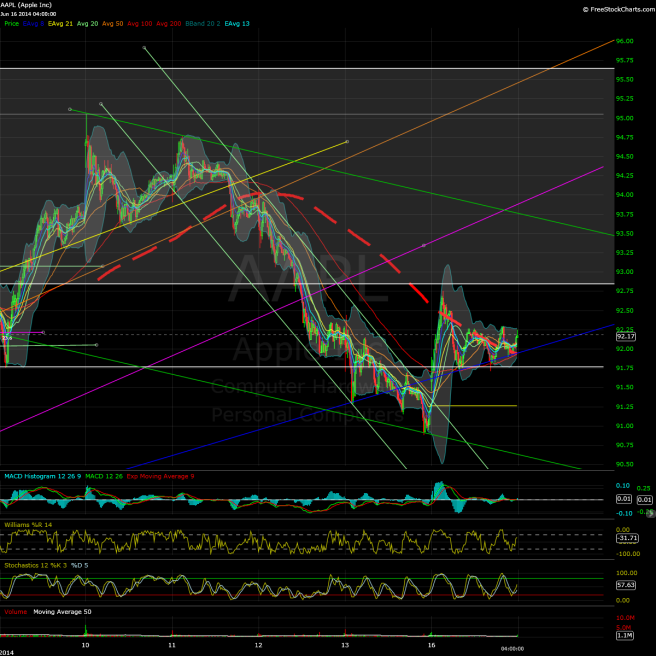
5-min chart:
– A nice break from the steep descending channel, though AAPL couldn’t hold above the low 92s for more than an hour today.
– Bears may have been hoping for a bear flag or something resembling a right shoulder – not just yet. Still very early, and it’s a 5-min chart after all, but AAPL’s making constructive higher lows for now.
– Back over Ye Old Resistance of 92 to close the session, and also above a potential battleground-type line at around 91.75. When you zoom out a bit it actually looks like the “entire” 91.75ish-92.85ish price band is worth watching at least short-term.
– More on the blue trendline in a bit.
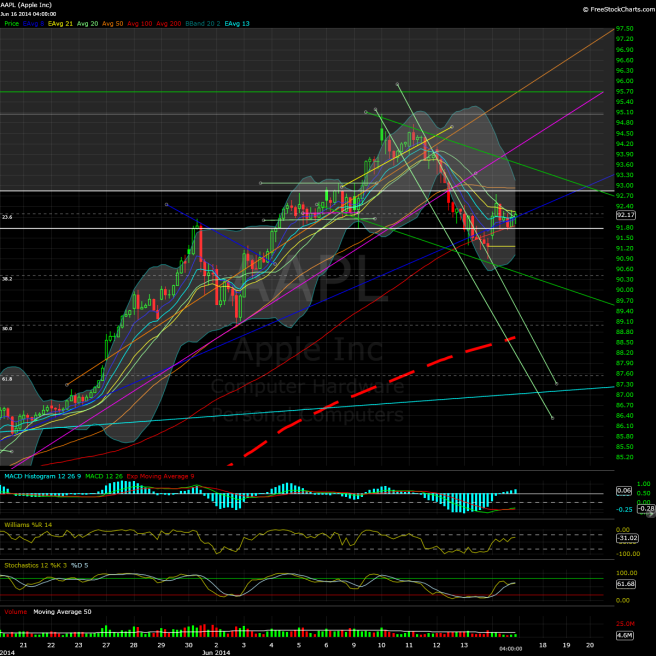
Hourly chart:
– Blue trendline appears to have been in play since around May 20. AAPL did break below on Friday, but reclaimed it with a little room to spare today. It does seem more like an accelerated trendline, though.
– AAPL escaped the micro-downtrend/oversold readings and generally had positive “follow-through” after the lagging indicator MACD-h went positive. Another provisional point in the bullish/constructive column.
– Still too early to tell if AAPL may be trading within yet another, bigger descending channel (darker green lines) – but I’m outlining one just in case.
– About the hourly mid-channel (SMA-20) from the weekend post. AAPL’s almost a dime above mid-channel as of the close (non-div-adjusted), so it’s improved its instantaneous composure quite a bit (took about three days to reclaim) while the Bollinger Bands are hinting at another volatility compression scenario before too long. For now composure is more “neutral” than “ready to challenge for new highs”, but we’ll see where things go from here. Considering that it was AAPL’s first real downside resolution on the hourly chart based on Bollinger Bands post-earnings – and the near-relentless upside at times before peaking – a net drop of about 2% from Thursday (intraday-high-to-close basis) doesn’t seem all that bad.
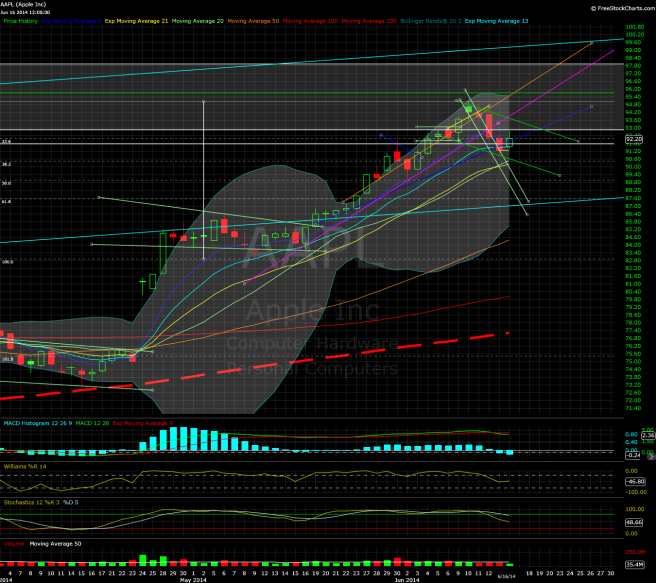
Wrapping up with the daily chart:
– AAPL tested the EMA-13 and ultimately ended up within a penny of the EMA-8. Just me, but I don’t see that as “rejection” yet. I’m sure some traders are looking at a possible bear flag on this timeframe formation based on today’s candle, though.
– Second day of downtrend per the MACD-h, but if price action is more rangebound than weak over the next few days, that’s likely a situation bulls can tolerate. Oscillators also taking the time to cool off a bit.
– Bollinger Bands continuing to compress, with the lower Bollinger Band crossing above 85 today and rising. In more intermediate terms, the trend is still bullish.
– Were AAPL to eventually continue on its uptrend without testing the 38.2% Fibonacci retrace level of the post-earnings sub-uptrend (from 82.93), that could be a very bullish sign.
– Maybe the stock split has something to do with but trading volume could be the lowest in at least two years on a pre-split basis. Not sure what to make of it at this point, aside from a general lack of trading interest by either side of the trade. Of course, liquidity is more than fine, considering the relative ease of buying and selling increments of less than $100.
See you on the virtual exchange floor Tuesday.


