I know, I know. You never know when those bad puns’ll turn up. 😉
Green day, but might there have been an early warning sign or two?
Let’s see what hints of clues may be in the charts. (Click for full resolution.)
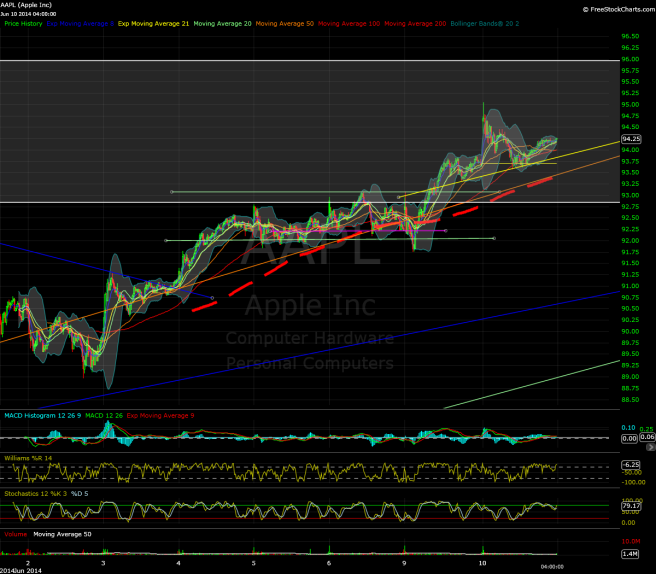
5-min chart:
– A few minutes of furious buying – and significant resistance at 95.05. Based on the 1-minute chart (not shown), looks like AAPL held 95 for all of three minutes. AAPL was slightly red in the middle of the day, recovering to slightly below the midpoint of the intraday range at the close.
– Bull flag triggered, but it’s not exactly a clean breakout, given the strong resistance early in the day.
– As AAPL continues on its accelerated trend, looks like a (micro-timeframe) head-and-shoulders-type pattern may be forming (starting from June 9). We’ll see if we get any other clues by the end of the week.
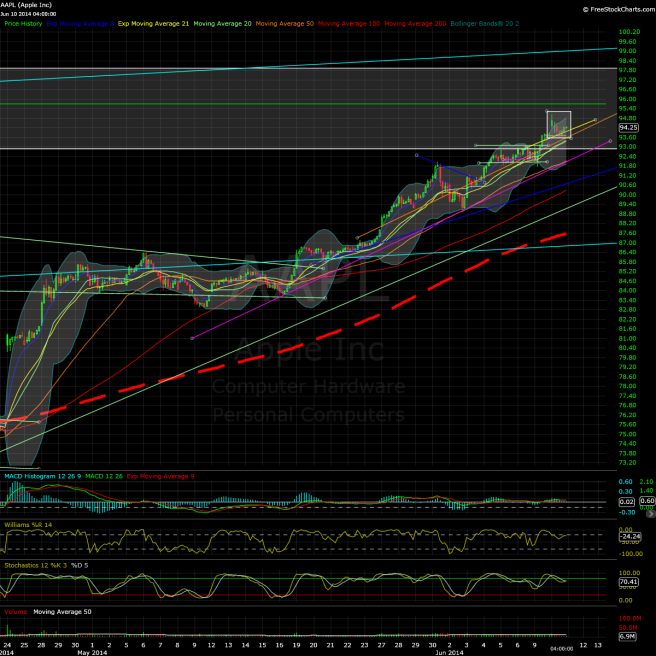
Hourly chart:
– Significant gap up at open (seems unique since earnings), gap was filled though the prior close did more or less hold.
– The frenetic, volatile nature of the rally is starting to show, but the AAPL’s still performing well per Bollinger Bands – mid-channel is at 93.35 and rising. Nothing too significant in the few indicators I track other than MACD-h being close to the zero line (though still very slightly positive). In the event of a negative crossover, will it amount to much in terms of downside?
– I’m looking into a 2-point trendline starting from May 16. We’ll see if it’s in play anytime soon.
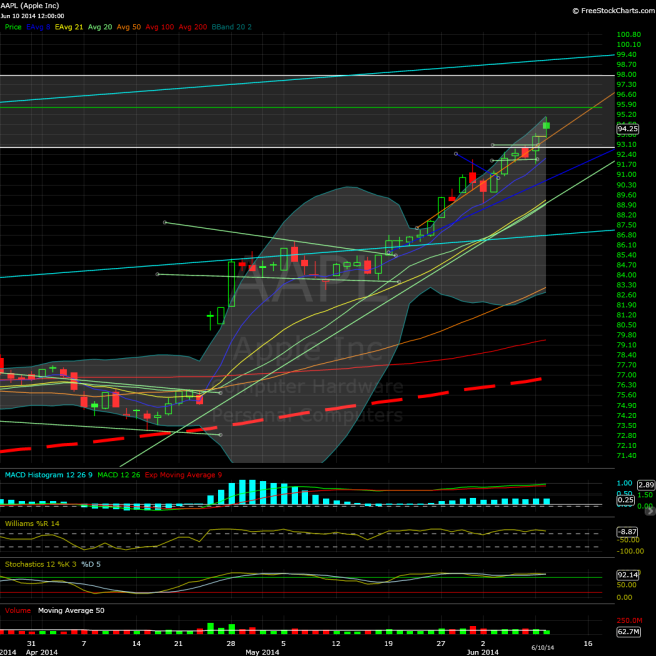
Daily chart:
– Seems AAPL’s started facing some headwinds in this 92.85-97.85ish zone, which isn’t too shocking considering that AAPL hit a pre-split high of 665 to start the day. That’s a 150+ point (pre-split basis) rally per my humble measurements – which is well over twice the average measured move of the previous three upwaves if my math is correct.
– Volume’s on the lower side, at around 60M shares, relative to the past couple of weeks.
– Still a “controlled” move per the Bollinger Bands, but even some bulls probably wouldn’t mind AAPL taking a break at this point. Since Apple might be hitting a news lull until iPhone (unless there’s a surprise new product category ready before that), maybe it’s not the worst time for AAPL to cool off and recharge momentum, right? (If you’re in the bullish camp, anyway.)
– The daily candle isn’t a “bad” one for bulls as far as I know, but it is a different one that might be worthy of attention. The open-to-last-price dropoff, though a seemingly modest 39 cents, is actually the most for a green candle in the roughly 3-month timeframe of this chart. There hasn’t been a filled green daily candle with that open-to-last-price drop-off or greater since early December, if my chart read is right. Too early to draw conclusions, but with the elevation being where it is, I’d figure I’d point it out. Of course, non-advice home gamer blog, just as a reminder. 😉
See you on the virtual exchange Wednesday.


FFS, would you please stop rooting for the AAPL rally to stop?!? TIA.
I’m not. It’s just my amateur interpretation of the price action today. Others may see it differently.
Keep up the good work. Ignore fools.
All opinions that don’t cross my arbitrary line – er, comments policy are welcome.