Welcome back, Kotter 600.
Was it really Nov. 1, 2012 when AAPL was last above that level? Granted, Apple Inc. has “thrown off” $20.15 per share in dividends since 2012 (the new $3.29/share/quarter dividend is just around the corner), but a level is still a level, and AAPL closing at 600+ and basically at intraday highs made quite the bullish statement.
Of course, with higher altitude comes higher risk, and the move from about 525 has been accelerated to say the least. Being fully aware of ever-present downside risk (retrace up to a certain point is always “healthy” in an uptrend), might other bullish indicators still exist? Let’s see if the charts have fragments of clues.
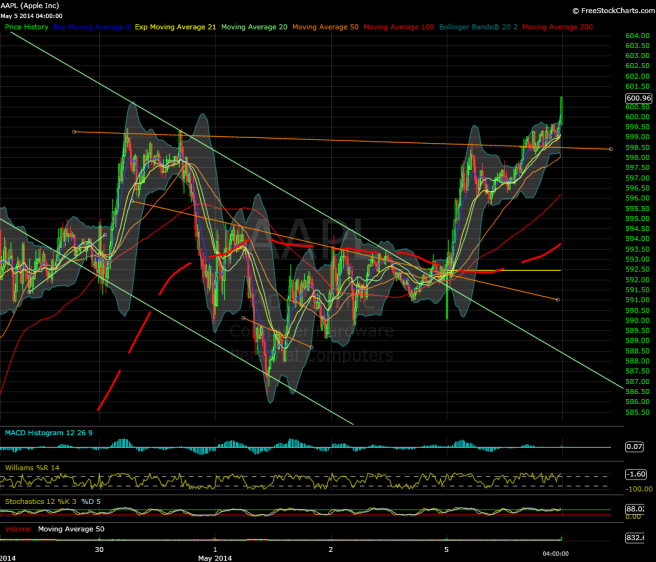
5-min chart:
– Was that some kind of quick descending channel breakout? Well, whatever the case, AAPL found support early in the day at exactly 590 and didn’t look back. What at first seemed like a mini-head-and-shoulders trigger really looks more like a controlled descending channel from about 10:30AM Eastern time, which in turn led to new highs not long after 2PM.
– This brings us to Potential Bullish Signal #1 (which might be more like 3-in-1). Notice the three orange lines? The lower two are pretty textbook-looking inverted head and shoulders reversal patterns – and yes, the larger one did meet (and exceed) its measured move target today. Did yet another inverted head and shoulders form (and begin to trigger) today? The question here is whether the inverted shoulders “qualify”, particularly the left shoulder (Apr. 30). Well, here’s a quick test – should this pattern be valid, the measured move should be around 10 points, suggesting a move up to around 608. We’ll see.
– 596 could be a new micro support level.
Hourly chart:
– Hey, something different today. Multiple somethings, actually.
– Potential Bullish Signal #2: Really, more of a collection, but since it’s just one timeframe, we’ll count them as one signal. MACD-h is now positive after close to 5 trading days in negative territory. Oscillators are now in overbought/bullish territory. AAPL vaulted over the SMA-20/Bollinger Band mid-channel and is currently attempting to resolve this volatility compression phase to the upside. AAPL held above the mega-macro trendline (according to my rough calculations, anyway) for the first time since December 26, 2013 (when AAPL was in the middle of heading *cough* south for the winter).
– Quite a change, from slightly bearish/neutral to very bullish in just one day. It remains to be seen whether the current price action is a fake-out (See April 10, for instance), but it really does seem the indicators I track are turning bullish at the right time, at the same time.
– Overall, the upper-level bull flag from 572.50 is still flying high. Does it imply a 20-point measured move after a confirmed trigger? Maybe the rest of the week will provide some clues.
Daily chart:
– Let’s just start with Potential Bullish Signal #3. Your analysis may vary, but I’ve circled the “peaks” of AAPL’s three previous major upside moves, including the current one. These moves all led to genuine higher highs. Is one of them a bit different? I submit the current set of candles is very unique compared to the others. See, the last three moves had a definitive “peak”, trailing off into a multi-week consolidation period. AAPL’s most recent move exceeded the ultimate measured moves of the previous three upwaves last Monday (at around 70 points vs. 60), and what happened? AAPL formed a very nice bull flag over four days, resulting in a clean breakout to a new closing and trend high.
– To me, that strongly implies additional momentum that simply didn’t exist in the previous moves. Is that a “guarantee” that AAPL will see 610 or so? No. But it’s a potential near-term price target to further validate the bullish case.
– AAPL continues to perform very well within the upper half of the Bollinger Bands, with the EMA-8 now at 583 and rising.
Bulls can’t really ask for more these days. Are they gaining still more control over the narrative now that the $600 barrier fell with relatively little effort, and on decent volume of around 10M shares?
See you on the virtual trading floor Tuesday!


